


Measure and shorten AI CRM time-to-value using baselines, revenue and productivity metrics, speed-to-lead tracking, A/B tests, and ROI formulas.
Time-to-Value (TTV) measures how quickly a customer starts seeing business results from a system like an AI-powered CRM. Faster TTV increases retention, boosts upselling opportunities, and reduces churn. AI CRMs, such as K3X, focus on outcomes rather than manual tasks, enabling quicker implementation and measurable results in days instead of weeks.
Here’s a simple breakdown of how to measure and improve TTV:
Define Value: Identify what "value" means for your business (e.g., higher win rates, shorter sales cycles).
Set Baselines: Gather 8–12 weeks of historical data on metrics like sales cycle length, lead conversion rates, and time spent on admin tasks.
Track Key Metrics:
Revenue Impact: Win rates, deal size, Customer Lifetime Value (CLV).
Productivity Gains: Hours saved, automation rates.
Pipeline Speed: Sales cycle length, speed-to-lead, forecast accuracy.
Use Tools: Real-time dashboards and A/B testing help monitor progress and fine-tune workflows.
Calculate ROI: Compare time saved, retention improvements, and revenue growth against CRM costs.
For example, K3X users save 8 hours per week per employee, cut follow-up time by 70%, and achieve payback in weeks. By focusing on outcomes and automating repetitive tasks, AI CRMs deliver faster and more measurable TTV compared to traditional systems.
3 AI Use Cases We Use in Sales Every Day (That Save 10+ Hours/Week)
Establishing Pre-Implementation Baselines
Before rolling out an AI CRM, it's essential to understand where you currently stand. Without documented baselines, proving ROI, justifying the investment to leadership, or showing tangible improvements becomes nearly impossible. Here's a compelling fact: companies that measure AI performance improve it three times faster than those that don't.
"What gets measured gets managed. Organizations that measure AI performance improve it 3 times faster than those that don't." - Teneo
Think of baselines as your "before" photo. They give you a clear starting point, turning vague assumptions into actionable insights. For example, companies using data-driven sales strategies see 41% higher revenue growth compared to those relying on intuition. The tricky part? Deciding which metrics matter most and ensuring consistent data collection.
Selecting the Right Baseline Metrics
Not all metrics deserve attention. Focus on those directly tied to your AI CRM's goals. For efficiency improvements, track metrics like process completion times and hours spent on administrative tasks. For revenue growth, look at win rates and pipeline velocity.
To make things manageable, organize your metrics into four categories:
Operational: Efficiency measures like time saved on repetitive tasks.
Customer: Satisfaction and retention metrics, such as Net Promoter Score (NPS) and churn rates.
Financial: ROI and cost savings.
Strategic: Competitive positioning and market share.
For sales teams, key metrics might include lead conversion rates, sales cycle length, and the percentage of time reps spend selling. Right now, sales reps only spend about 28% of their time actually selling - the rest is consumed by data entry and other manual tasks.
Customer-focused metrics are just as critical. Before implementation, document your current NPS, Customer Satisfaction (CSAT) scores, and churn rates. Why? Even a modest 5% boost in customer retention can increase profits by 25% to 95%.
Balance is key. Track both leading metrics (like lead response time and follow-up rates, which show results within weeks) and lagging metrics (such as win rates and sales cycle length, which take longer to reflect changes). This dual approach ensures you capture both early wins and long-term impacts.
To avoid confusion, standardize definitions upfront. Agree on what counts as a "qualified lead" or a "closed opportunity" to ensure benchmarks are consistent across the board. Once these definitions are clear, you're ready to gather historical data.
Gathering Historical Data
After identifying your key metrics, the next step is compiling historical data to establish a solid baseline. Ideally, you'll need 8–12 weeks of historical data to account for seasonal trends and outliers. During the first four weeks of AI CRM deployment, focus solely on collecting this data before fully integrating AI.
Start by calculating your average win rate and sales cycle length from the past two quarters. Work with Marketing Operations to determine your current blended Cost per Opportunity (CPO) across all channels, including paid ads, outbound prospecting, and inbound leads. Additionally, document your "touches to close" baseline by tracking the average number of manual interactions required to close a deal.
Survey your teams monthly to measure the time spent on administrative tasks like logging calls, setting reminders, and creating reports. This will help you establish a "time-saved" baseline. Also, assess the quality of your current data - how much of it is clean and structured? Poor data quality can severely limit AI's effectiveness.
For the most accurate results, consider using a control group. Compare AI-managed groups against a matched control group with identical lead sources and service-level expectations. This approach isolates the true impact of AI. Finally, leverage automated tools within your existing CRM and financial systems to systematically collect historical data. Document everything thoroughly before launching your AI CRM.
Core Metrics for Measuring AI CRM Time-to-Value
Once you've established your baselines, it's time to measure how your AI CRM delivers results. To do this, track financial, operational, and performance metrics to determine ROI.
"Measuring AI ROI means linking performance metrics directly to business outcomes that affect revenue, cost, and long-term growth." - Allen Levin, Authority AI
Metrics are most meaningful when tied to business outcomes. For instance, tracking "hours saved" is only impactful if it’s translated into monetary value or capacity improvements. Between January and June 2024, GreenTech Solutions took this approach to validate their AI CRM investment. By cutting admin time from 14.2 hours to 2.1 hours per week per rep, they boosted their close rate from 16.8% to 21.3%, delivering $740,000 in annual value.
Focus on three main areas: revenue impact (like win rates and Customer Lifetime Value), productivity gains (such as hours saved or automation rates), and pipeline speed (like shorter sales cycles or faster lead responses). Each offers insights into financial returns, operational improvements, and competitive positioning.
On average, CRM systems deliver $8.71 for every $1 invested. AI-powered systems like K3X can push this further by automating tasks that previously took up 70–90% of manual data entry time. For example, Ruby Capital Group saw a 70% drop in follow-up time and tripled ticket resolution speed within just two days of adopting K3X in December 2024. These metrics are essential for understanding your CRM’s time-to-value.
Revenue Impact
Revenue metrics reveal whether your AI CRM is driving financial growth. Start by monitoring win rates, which measure the percentage of opportunities that close successfully. With AI, businesses often see a 15–25% revenue lift due to improved engagement, as shown through before-and-after comparisons.
Another critical metric is average deal size. AI tools that qualify leads and identify upsell opportunities can increase deal values. GreenTech Solutions saw a 7.3% rise in average deal size after implementing AI. Track this monthly and compare it to pre-AI figures.
Revenue per sales representative is another key indicator of efficiency. Divide total revenue by the number of reps to see if your team is closing more deals. Teams using K3X often see this metric improve as reps spend less time on admin tasks and more time selling.
Lastly, monitor Customer Lifetime Value (CLV), which reflects the total revenue a customer generates over their relationship with your business. AI can flag at-risk accounts using behavioral data. Calculate CLV using this formula: (Average Revenue per Customer × Gross Margin) ÷ Churn Rate. Strong revenue metrics point to faster time-to-value.
Next, assess how automation improves team productivity.
Productivity Gains
Productivity metrics help quantify the time saved by your team. A simple way to measure this is hours saved per week per employee. Track how much time AI saves on tasks like data entry, report creation, and lead research.
To assign a dollar value to these savings, multiply the saved hours by your team’s hourly cost (Salary + Commission + Benefits ÷ Total Hours). For example, if a rep earning $75,000 annually saves 7 hours weekly, that’s about $252 per week or $13,100 annually in recovered capacity.
K3X users save an average of 8 hours per week per employee. For a team of 10, that’s 80 hours saved weekly - equivalent to adding two full-time employees. This extra capacity can be redirected to high-impact activities like nurturing prospects and strengthening client relationships.
Track automation rates for specific tasks to see how much manual work AI eliminates. These gains directly contribute to reducing time-to-value.
Finally, evaluate how your AI CRM accelerates deal progression and improves pipeline quality.
Pipeline Speed and Quality
Pipeline metrics show whether your AI CRM is speeding up deal progression and improving forecast reliability. Start by tracking sales cycle length - the time it takes to close a deal. AI automation can cut sales cycles by 26%. Compare this metric monthly to your pre-AI benchmarks.
Speed-to-lead measures how quickly your team responds to new inquiries. Responding within an hour can increase conversion chances by 7×, while responding within five minutes can boost conversions by 8×. AI CRMs like K3X handle initial outreach automatically, eliminating response delays. Metrics like lead-to-meeting conversion rates and autonomous handling rates further illustrate pipeline efficiency.
Forecast accuracy is another crucial measure. Compare predicted versus actual closed deals to see if AI improves revenue predictions. Better forecasts reduce surprises and build leadership confidence in your CRM.
Finally, calculate pipeline velocity using this formula: (Number of Opportunities × Win Rate × Average Deal Size) ÷ Sales Cycle Length. An increase in velocity after implementing AI indicates your CRM is driving faster business outcomes and reducing time-to-value.
Methods for Tracking and Improving Time-to-Value
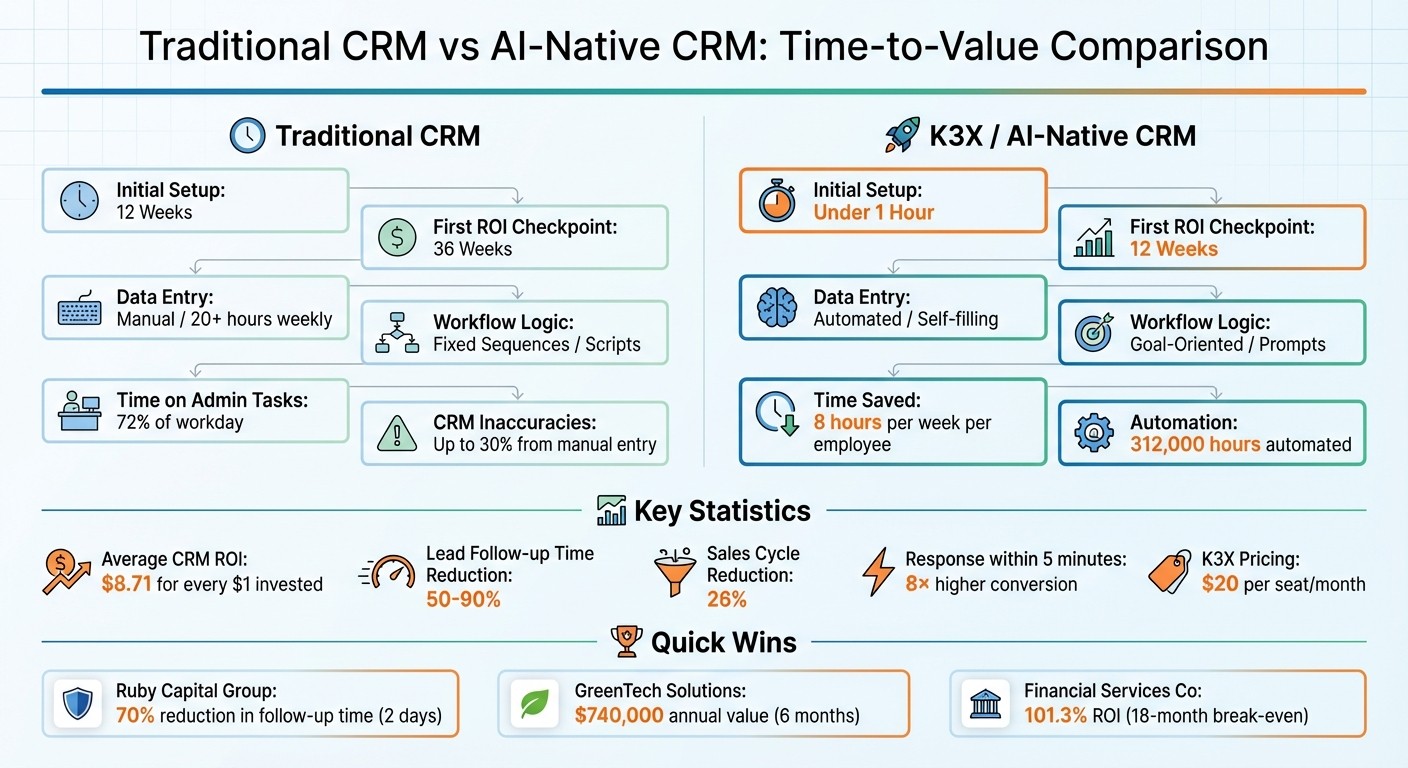
Traditional CRM vs AI-Native CRM Time-to-Value Comparison
To effectively monitor and improve Time-to-Value (TTV), use both leading indicators (like AI usage, prompt volume, and speed-to-lead) and lagging indicators (such as win rates, revenue, and cycle length). Leading indicators help predict outcomes, while lagging indicators confirm results, giving you a full view of your AI CRM's performance and where changes might be needed.
Real-Time Dashboards and Automation
Real-time dashboards are one of the best tools for keeping tabs on these metrics. They sync directly with your CRM, eliminating the need for manual updates - an area that can account for up to 30% of CRM inaccuracies. Automating data entry through tools like Webhooks or APIs ensures your dashboards reflect actual buyer behavior in real time. For example, K3X automatically logs emails, records calls, and updates contact records, keeping your data accurate and actionable.
Customizing dashboards for different roles can further improve tracking. For instance, SDRs should focus on metrics like qualification rates and response times, while managers can monitor pipeline velocity and forecast accuracy. Smart triggers add another layer of usefulness by alerting you when key performance indicators (KPIs) fall below a set threshold - like no follow-up within 60 minutes. This automated feedback loop makes it easier to address issues quickly and continuously improve TTV.
K3X also saves time by automating activity logging, cutting out an average of 8 hours of manual data entry per week per employee. This ensures your analytics always reflect real activity without the need for constant oversight.
Using A/B Testing for Insights
A/B testing is a powerful way to measure how your AI CRM is performing compared to your previous system. Start small by isolating one workflow, like inbound lead qualification, instead of testing multiple sales processes at once. Split your team into test and control groups - one using K3X and the other sticking with your traditional CRM. Keep external factors like lead source, offer, and team experience consistent to ensure fair comparisons.
Over 30 to 60 days, track metrics such as speed-to-lead, lead-to-opportunity conversion rates, and time saved per rep. For example, responding to a lead within five minutes can boost conversion rates by up to 8× compared to slower responses. K3X automates initial outreach, giving you a measurable edge.
A logistics company that adopted this approach in January 2024 saw dramatic results. Before automating its RFQ processing, each request took 2.5 hours and had a 15% error rate. Post-automation, processing time dropped to just 20 minutes per RFQ with a 3% error rate. Over 30 days, the company saved 86.7 hours per week, achieved a payback period of three weeks, and projected an annual ROI of 1,647%.
Calculating ROI
To calculate ROI, you’ll need to account for both costs and benefits. Use this formula:
CRM ROI = (Time Saved + Retention Value + Lead Quality Lift + Conversion Gain) ÷ Total CRM Cost.
For K3X, costs include the $20 per seat base fee plus any additional AI credits used during high-activity months. On the benefits side, calculate time savings using this formula:
(Old Task Time – New Task Time) × Weekly Volume.
Multiply the result by the loaded hourly rate to get the productivity ROI. For example, if a rep earning $75,000 annually saves 8 hours per week, that’s roughly $288 per week or $14,976 annually in recovered capacity.
A financial services company with 200 employees provides a great example. In August 2025, they invested $795,000 over three years for an AI-powered CRM, covering technology, training, and support. They quantified $1.6 million in benefits: $560,000 from revenue growth, $420,000 from cost reductions, $380,000 from reduced churn, and $240,000 from avoided hiring. This resulted in an ROI of 101.3%, with break-even achieved in just 18 months.
As EverWorker wisely put it:
"The winning ROI narrative is not 'we saved 200 hours,' but 'we turned 200 hours into 40 more qualified meetings and 10 more opportunities.'" – EverWorker
Rapid ROI Tracking
Adopt a 30-day framework to track immediate ROI. Spend the first two weeks collecting baseline metrics like time per task and error rates, then monitor the same metrics for four weeks post-automation. K3X's fast deployment (under an hour) allows you to start tracking ROI almost immediately, compared to the 12 weeks typically required for traditional CRM setups.
Metric | Traditional CRM | K3X / AI-Native CRM |
|---|---|---|
Initial Setup | 12 Weeks | Under 1 Hour |
First ROI Checkpoint | 36 Weeks | 12 Weeks |
Data Entry | Manual / 20+ hours weekly | Automated / Self-filling |
Workflow Logic | Fixed Sequences / Scripts | Goal-Oriented / Prompts |
How to Speed Up Time-to-Value with K3X

K3X’s prompt-driven design eliminates the usual headaches of traditional CRM setup. Instead of spending weeks on manual configurations, you can get up and running in less than an hour. How? The system flips the script: you define the outcome you want, and K3X handles the rest. This approach not only simplifies onboarding but also lays the groundwork for automations that drastically cut down time-to-value (TTV).
Using Prompt-Driven Automations
Most CRMs rely on rigid workflows: "Send an email, wait two days, follow up, wait three more days." These sequences often break when leads respond unpredictably. K3X takes a different route. You simply describe what you want - like “Book demo calls with every unresponsive lead” - and the AI takes care of follow-ups, pipeline updates, and responses in real time.
Take Ruby Capital Group as an example. In December 2025, CEO Michael Chkechkov set up their entire automation system in just two days. Here's what he had to say:
"Our sales team was spending half their day on admin work. Now they're talking to customers and closing deals. The automation handles everything from lead qualification to contract routing." – Michael Chkechkov, CEO, Ruby Capital Group
K3X also eliminates the need for third-party tools like Zapier or Make by offering native integrations. Need to tweak your strategy? Just update the prompt, and the system adapts instantly - no disruptions, no extra steps.
Avoiding Common CRM Limitations
K3X goes beyond just automating tasks; it removes the technical hurdles that often bog down traditional CRMs. Many systems force teams to spend over 20 hours a week on manual data entry. K3X automates those repetitive tasks - logging calls, updating contact info, and tracking email interactions - saving users an average of 8 hours per employee every week.
There’s no need for coding skills, complex flowcharts, or IT support. Everything runs on natural language prompts. Mykyta Samusiev, Founder & CEO of K3X, explains it best:
"We’re building a CRM that works the way people expect it to, not through menus, workflows, or complexity, but through intention. You tell it the outcome. The system figures out the work." – Mykyta Samusiev, Founder & CEO, K3X
The results speak for themselves. Across its user base, K3X has automated 312,000 hours of work, saved $12.4 million in operational costs, and boosted report generation speed by 92%. Compliance accuracy? An impressive 99.8%.
Monitoring Performance in Real Time
Once deployed, K3X’s adaptive dashboard takes over, providing real-time insights into deal progress and bottlenecks. Unlike static reports that require constant updates, this dashboard dynamically tracks performance and adjusts workflows based on user behavior and lead activity. If a key metric dips below your expectations, you can refine the prompt immediately and see the changes take effect - no need to wait for the next reporting cycle.
Over time, the system learns from your team’s habits, becoming smarter and more efficient. Instead of locking you into a fixed setup, K3X evolves alongside your business, helping you identify and resolve bottlenecks while continuously improving execution.
At just $20 per seat per month - including 1,000 AI credits - K3X’s pricing is as flexible as its functionality. During slower months, costs drop to the base rate, ensuring you only pay for what you use.
Conclusion
Measuring the time-to-value for AI-powered CRM systems is about showing quick, tangible business results. Companies making this leap are moving away from manual data entry and static reporting, embracing systems that learn, adapt, and take action independently. By tracking the right metrics - outlined earlier - you can show returns in weeks instead of months.
Traditional CRMs burden teams with 72% of their time spent on administrative tasks instead of selling. AI-native platforms like K3X flip this script by automating follow-ups, pipeline updates, and data capture in real time. This shift allows sales reps to reclaim 5 to 8 hours each week while boosting efficiency by up to 30%. As Alexander Christie, CTO of Attio, explains:
"Retrofitted solutions will always be less effective because the foundations of legacy CRMs weren't designed for the scale, autonomy, and extensibility that AI demands".
These numbers highlight the transformative potential of AI-driven systems. The transition from static "systems of record" to dynamic decision-making engines is already happening. For example, AI-powered tools can reduce lead follow-up times by 50% to 90%.
K3X simplifies this transformation. Priced at $20 per seat per month with 1,000 AI credits included, it offers a platform that adapts to your team's workflows and scales as your business grows - without the headaches of retrofitted AI solutions. The first 90 days are critical for establishing long-term success, and K3X delivers measurable results from the start. This streamlined approach not only accelerates outcomes but also positions your team to navigate evolving market demands.
If you're aiming for faster ROI, cleaner data, and smarter execution, it's time to move beyond traditional workflows. The real question isn't whether AI will reshape your CRM - it's whether you're ready to capitalize on these proven strategies.
FAQs
What’s the best way to define “value” for my AI CRM?
Defining "value" for your AI CRM starts with pinpointing the core benefits your business wants to achieve - think better customer engagement, streamlined operations, or boosting revenue. With AI-native CRMs like K3X, the focus shifts from workflows to outcomes. These outcomes are powered by prompt-driven automation, which cuts down on manual tasks, speeds up processes, and aligns with key goals like quicker onboarding, improved conversion rates, or stronger customer retention.
How can I measure AI CRM impact with messy baseline data?
Shift your focus to real-time, automated KPI tracking that works independently of perfectly clean historical data. Metrics like response times, activity quality, and pipeline velocity are ideal for this approach. These are measurable in the moment, with AI systems capturing and updating them automatically.
By sidestepping the need for spotless historical data, you can concentrate on operational improvements and actionable insights in real time. This makes it easier to evaluate the actual impact of AI on your processes. Instead of relying on static, past-focused metrics, prioritize the continuous tracking of efficiency and business outcomes to stay aligned with current goals and performance.
What leading indicators predict time-to-value fastest?
When it comes to gauging how quickly an AI CRM system, like K3X, can start delivering results, there are a few key metrics to keep an eye on:
AI readiness and enablement: This measures how prepared your team and infrastructure are to integrate AI tools effectively. A strong foundation here often means faster adoption and smoother implementation.
AI usage and engagement: Tracking how actively the system is being used can reveal early signs of success. High engagement typically correlates with quicker value realization.
Speed-to-lead: This reflects how quickly your team acts on leads generated by the system. Faster response times often lead to better outcomes and greater efficiency.
By monitoring these indicators, you can get a clearer sense of how quickly the system is driving tangible results for your business.